Talal El-Houni

MSc in Health Data Science, skilled in Python and SQL, turning data into strategic insights in healthcare and market research.
Driven by the potential of technology to improve lives, ready for fresh challenges with a mix of analytical prowess and creative problem-solving.
View My LinkedIn Profile
Dynamic Sales Performance Dashboard in Excel
Project Overview
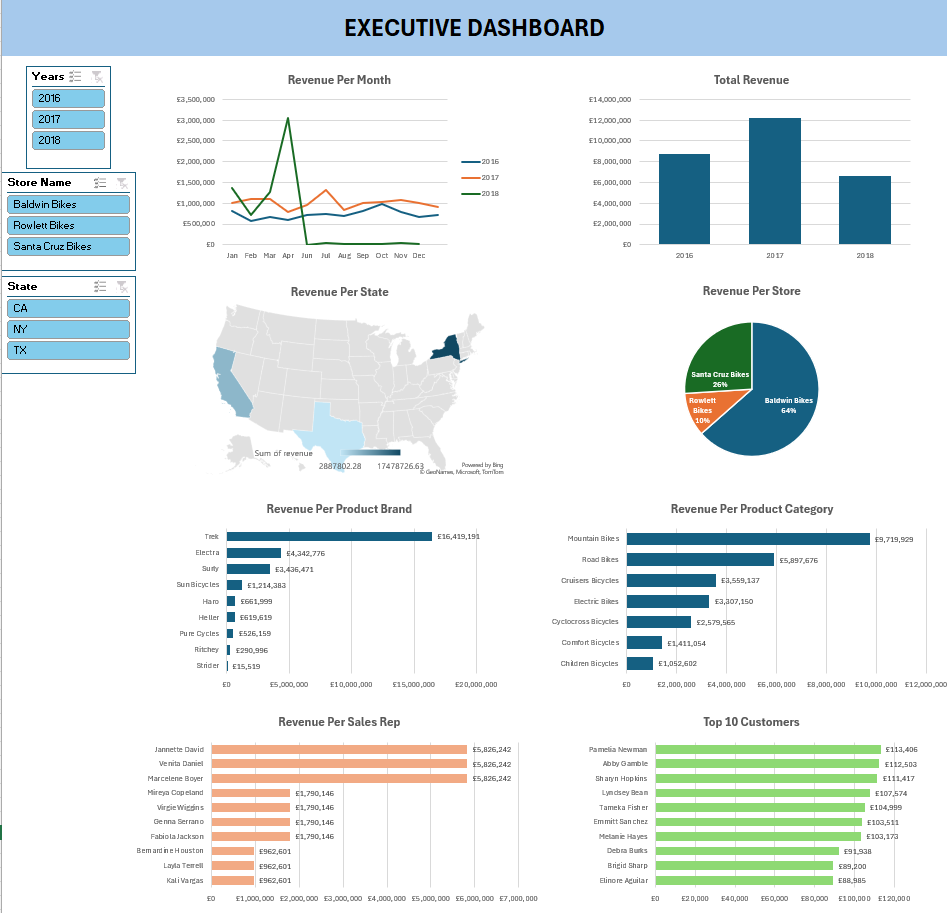
This project demonstrates the creation of a comprehensive Excel dashboard for analysing sales performance, based on a client engagement. The dashboard, recreated here with mock data, originated from a need to provide in-depth insights into sales operations over the 2016 to 2018 period. A key part of the project involved using SQL for data extraction and preparation, showcasing my ability to integrate data analysis tools for insightful visualisations.
Key Features:
- Data Extraction with SQL: Employed SQL scripts to retrieve and prepare data from the client’s relational database, ensuring accurate and relevant data feeds into the Excel dashboard.
- Interactive Dashboard: Utilises Excel to dynamically explore and visualise sales data across multiple dimensions, including temporal trends, geographic analysis, store performances, and product category insights.
- Customisable Views: Features slicers for filtering data by year, store name, and state, facilitating detailed analysis of specific aspects of the sales data.
- Comprehensive Analysis: Offers trend visualisation, revenue breakdowns by various categories, and rankings of top customers and sales representatives.
Business Questions Addressed:
- What is the condition of sales activities within the company from 2016 to 2018?
- How do sales volumes and revenues trend over this period?
- What are the detailed revenues per region, store, product category, and brand?
- Who are the top customers and sales representatives?
Tools Used
- SQL: For data extraction and preparation from the company’s relational database, highlighting the importance of data accuracy and relevance.
- Excel: Used for creating pivot tables, dynamic dashboards, and data visualisation to convey complex information in an understandable format.
How to Use the Dashboard
- Data Filtering: Employ slicers to adjust the dashboard according to year, store name, and state for targeted analysis.
- Trend Exploration: Analyse sales trends and performance metrics through a variety of charts and tables designed for maximum insight.
- Deep Dives: Utilise detailed breakdowns for comprehensive performance analysis across different sales dimensions.
Conclusion
This project illustrates my proficiency with both SQL for data management and Excel for data analysis and visualisation. It underscores the capability to leverage these tools in tandem to deliver actionable business insights and support strategic decision-making.
This project is based on mock data and intended for portfolio presentation only.